


Warning signs of a new bubble are once again appearing in the technology sector – and specifically in the TMT (Technology, Media & Telecom) sector, which is the dominant and most important sector of the S&P 500.
According to Trust Economics, TMT stock valuations have reached historic highs, while the risk of overconcentration, especially if you exclude “giants” stocks, is greater than at any time since the peak of the 2000 bubble.
With capitalization concentration continuing to increase – the 10 largest companies now account for 33% of the total value of the S&P 500 – internal correlations within TMT are intensifying, while the total capitalization of the sector far exceeds its fundamentals.
TMT stocks have hit their highest valuation since 2009, recovering from trade war lows. However, maintaining that premium now depends on continued earnings outperformance.
The forward P/E ratio stands at 26.7x – higher than the post-crisis high of 26.3x – and 8.7 standard deviations above the 2015-2019 average (16.9x).

At the same time, average annual earnings growth stands at 8.8%, compared to 5.8% for the broader index.
In the second half of 2025, TMT companies are expected to grow their earnings by 11.8%, a pace 1.8 times faster than the S&P 500. However, in 2026, this difference is estimated to narrow, with forecasts showing a rise of 15.5% for the sector and 12.3% for the index, which may put pressure on valuations.
For comparison, the equal-weighted S&P 500 is trading at 17.9 times, below pre-crisis levels and just 1.1 points above the five-year pre-Covid average.

Rising Correlations and Risk of Correction
Internal stock correlations within the TMT are rising again, reflecting periods of past stress and turmoil.
The rolling 26-week average correlation between stocks in the sector is 0.49 – above the average since 2010 and almost three times the 2024 low of 0.18. Similar events were recorded in July 2021 and December 2017. In both cases, stock corrections followed about six months later.

The pattern appears to be repeating in 2025, six months after the summer 2024 lows.
Per-stock correlations in the technology and telecommunications subsectors are also above historical averages – at 0.54 and 0.38 respectively – and continue their upward trajectory from the 2024 lows.

The problem is not just concentration, but also capitalization
TMT’s share of the S&P 500’s total capitalization is now at levels comparable to those of the dot-com bubble.
Specifically, the sector accounts for 44.2% of the index’s total capitalization – surpassing the post-pandemic high of 42.8% in June 2024 and approaching the historical record of 44.7% in February 2000.
Before the pandemic, the share was 33.8%, compared to a long-term average of 26.7%.
Despite the correction in early 2025, losses in the rest of the index’s stocks were greater, as a result of which investors returned to technology stocks. However, 2026 earnings forecasts suggest a possible shift towards neglected sectors of the market.
While TMT’s market share is linked to its increased contribution to the index’s earnings, this advantage is expected to be limited. The sector currently contributes 38.1% of earnings and 20.6% of the index’s revenue.
From the third quarter of 2025 to the end of 2026, TMT’s share of earnings is projected to decline to 36.7%.
Particularly significant corrections may also be seen in the “Magnificent Seven” – Amazon.com, Tesla and other tech giants – which currently account for 33.2% of market capitalization but are projected to contribute just 25% to quarterly earnings by the end of 2026.
Valuations without mega-caps are even more worrisome
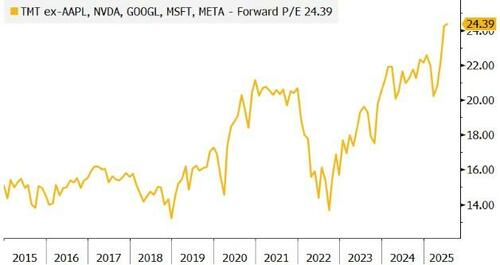
Perhaps most striking is that TMT valuations look even more exaggerated when you strip out Apple, Microsoft, Nvidia, Alphabet, and Meta.
Excluding them, the sector’s P/E reached 24.4x in 2024—a new all-time high—and is 11.7 standard deviations above the 2015-2019 average.

TMT’s high valuations are closely tied to strong earnings expectations. The sector’s top-valued stocks are projected to grow earnings by 18.8% next year, while the bottom 20% (in P/E terms) are expected to grow by just 4%.